


.jpg?#)


Old Missions, New Discoveries: NASA’s Data Archives Accelerate Science
Every NASA mission represents a leap into the unknown, collecting data that pushes the boundaries of human understanding. But the story doesn’t end when the mission concludes. The data carefully preserved in NASA’s archives often finds new purpose decades later, unlocking discoveries that continue to benefit science, technology, and society. “NASA’s science data is one […]

5 min read
Old Missions, New Discoveries: NASA’s Data Archives Accelerate Science

Every NASA mission represents a leap into the unknown, collecting data that pushes the boundaries of human understanding. But the story doesn’t end when the mission concludes. The data carefully preserved in NASA’s archives often finds new purpose decades later, unlocking discoveries that continue to benefit science, technology, and society.
“NASA’s science data is one of our most valuable legacies,” said Kevin Murphy, NASA’s chief science data officer at NASA Headquarters in Washington. “It carries the stories of our missions, the insights of our discoveries, and the potential for future breakthroughs.”
NASA’s science data is one of our most valuable legacies.

Kevin Murphy
Chief Science Data Officer, NASA Science Mission Directorate
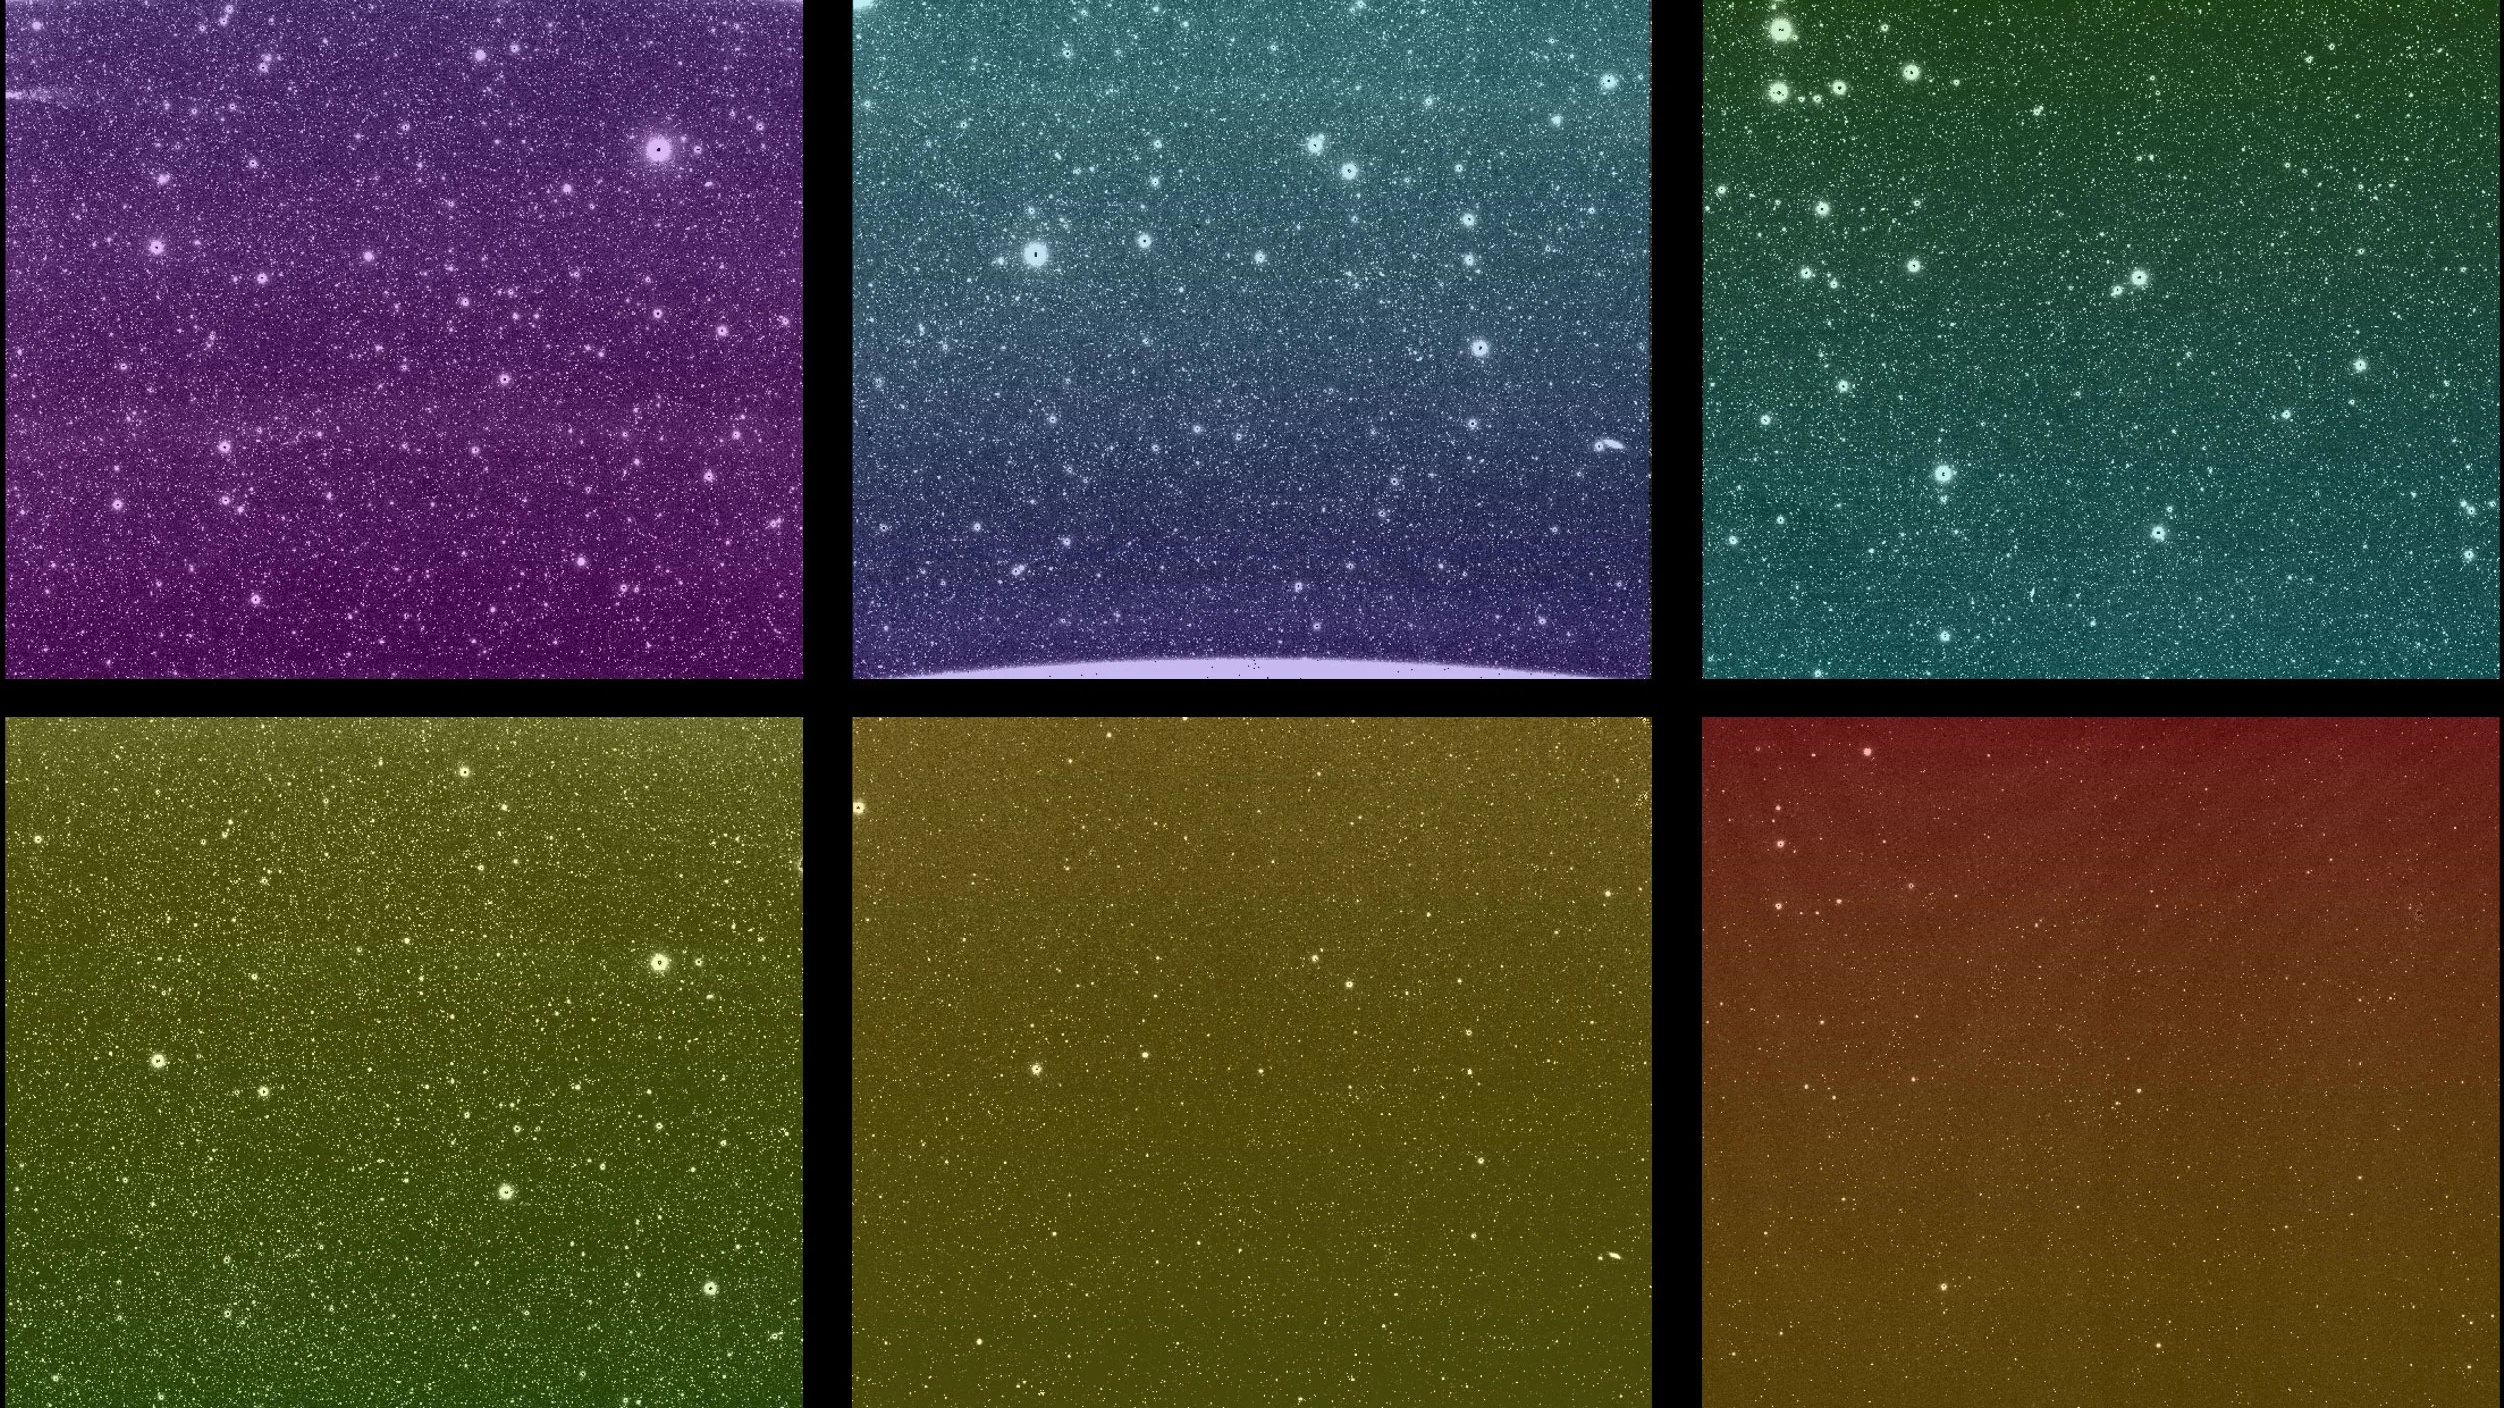
NASA’s Science Mission Directorate manages an immense amount of data, spanning astrophysics, biological and physical sciences, Earth science, heliophysics, and planetary science. Currently, NASA’s science data holdings exceed 100 petabytes—enough to store 20 billion photos from the average modern smartphone. This volume is expected to grow significantly with new missions.
This vast amount of data enables new discoveries, connecting scientific observations together in meaningful ways. Over 50% of scientific publications rely on archived data, which NASA provides to millions of commercial, government, and scientific users.

Managing and stewarding such massive volumes of information requires careful planning, robust infrastructure, and innovative strategies to ensure the data is accessible, secure, and sustainable. Continued support for data storage and cutting-edge technology is key to ensuring future generations of researchers can continue to explore using science data from NASA missions.
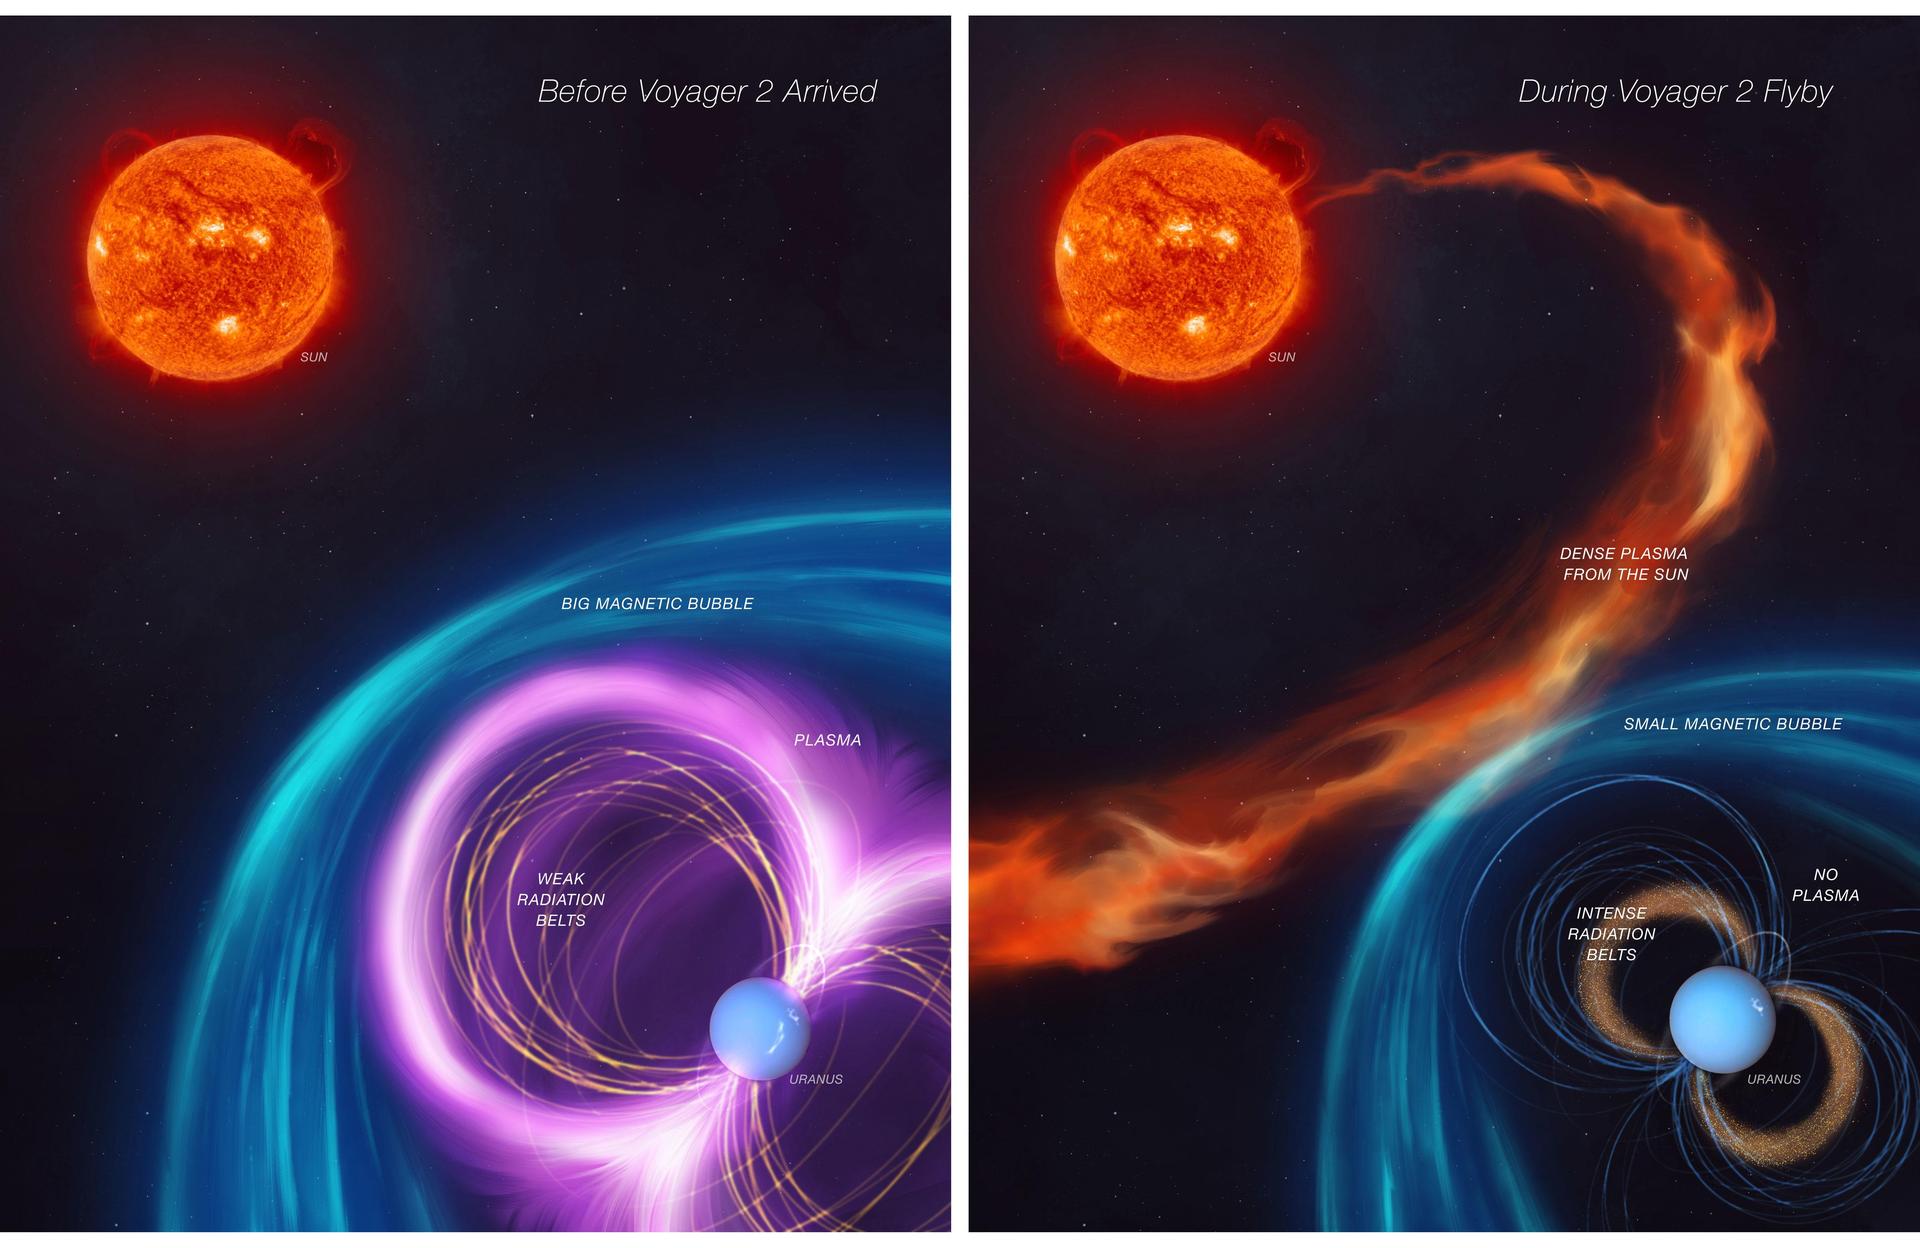
Modern technology, such as image processing and artificial intelligence, helps unlock new insights from previous observations. For example, in 1986, NASA’s Voyager 2 spacecraft conducted a historic flyby of Uranus, capturing detailed data on the planet and its environment. Decades later, in the early 2000s, scientists used advanced image processing techniques on this archival data to discover two small moons, Perdita and Cupid, which had gone unnoticed during the initial analysis.
In 2024, researchers revisited this 38-year-old archival data and identified a critical solar wind event that compressed Uranus’s magnetosphere just before the Voyager 2 flyby. This rare event, happening only about four percent of the time, provided unique insights into Uranus’s magnetic field and its interaction with space weather.
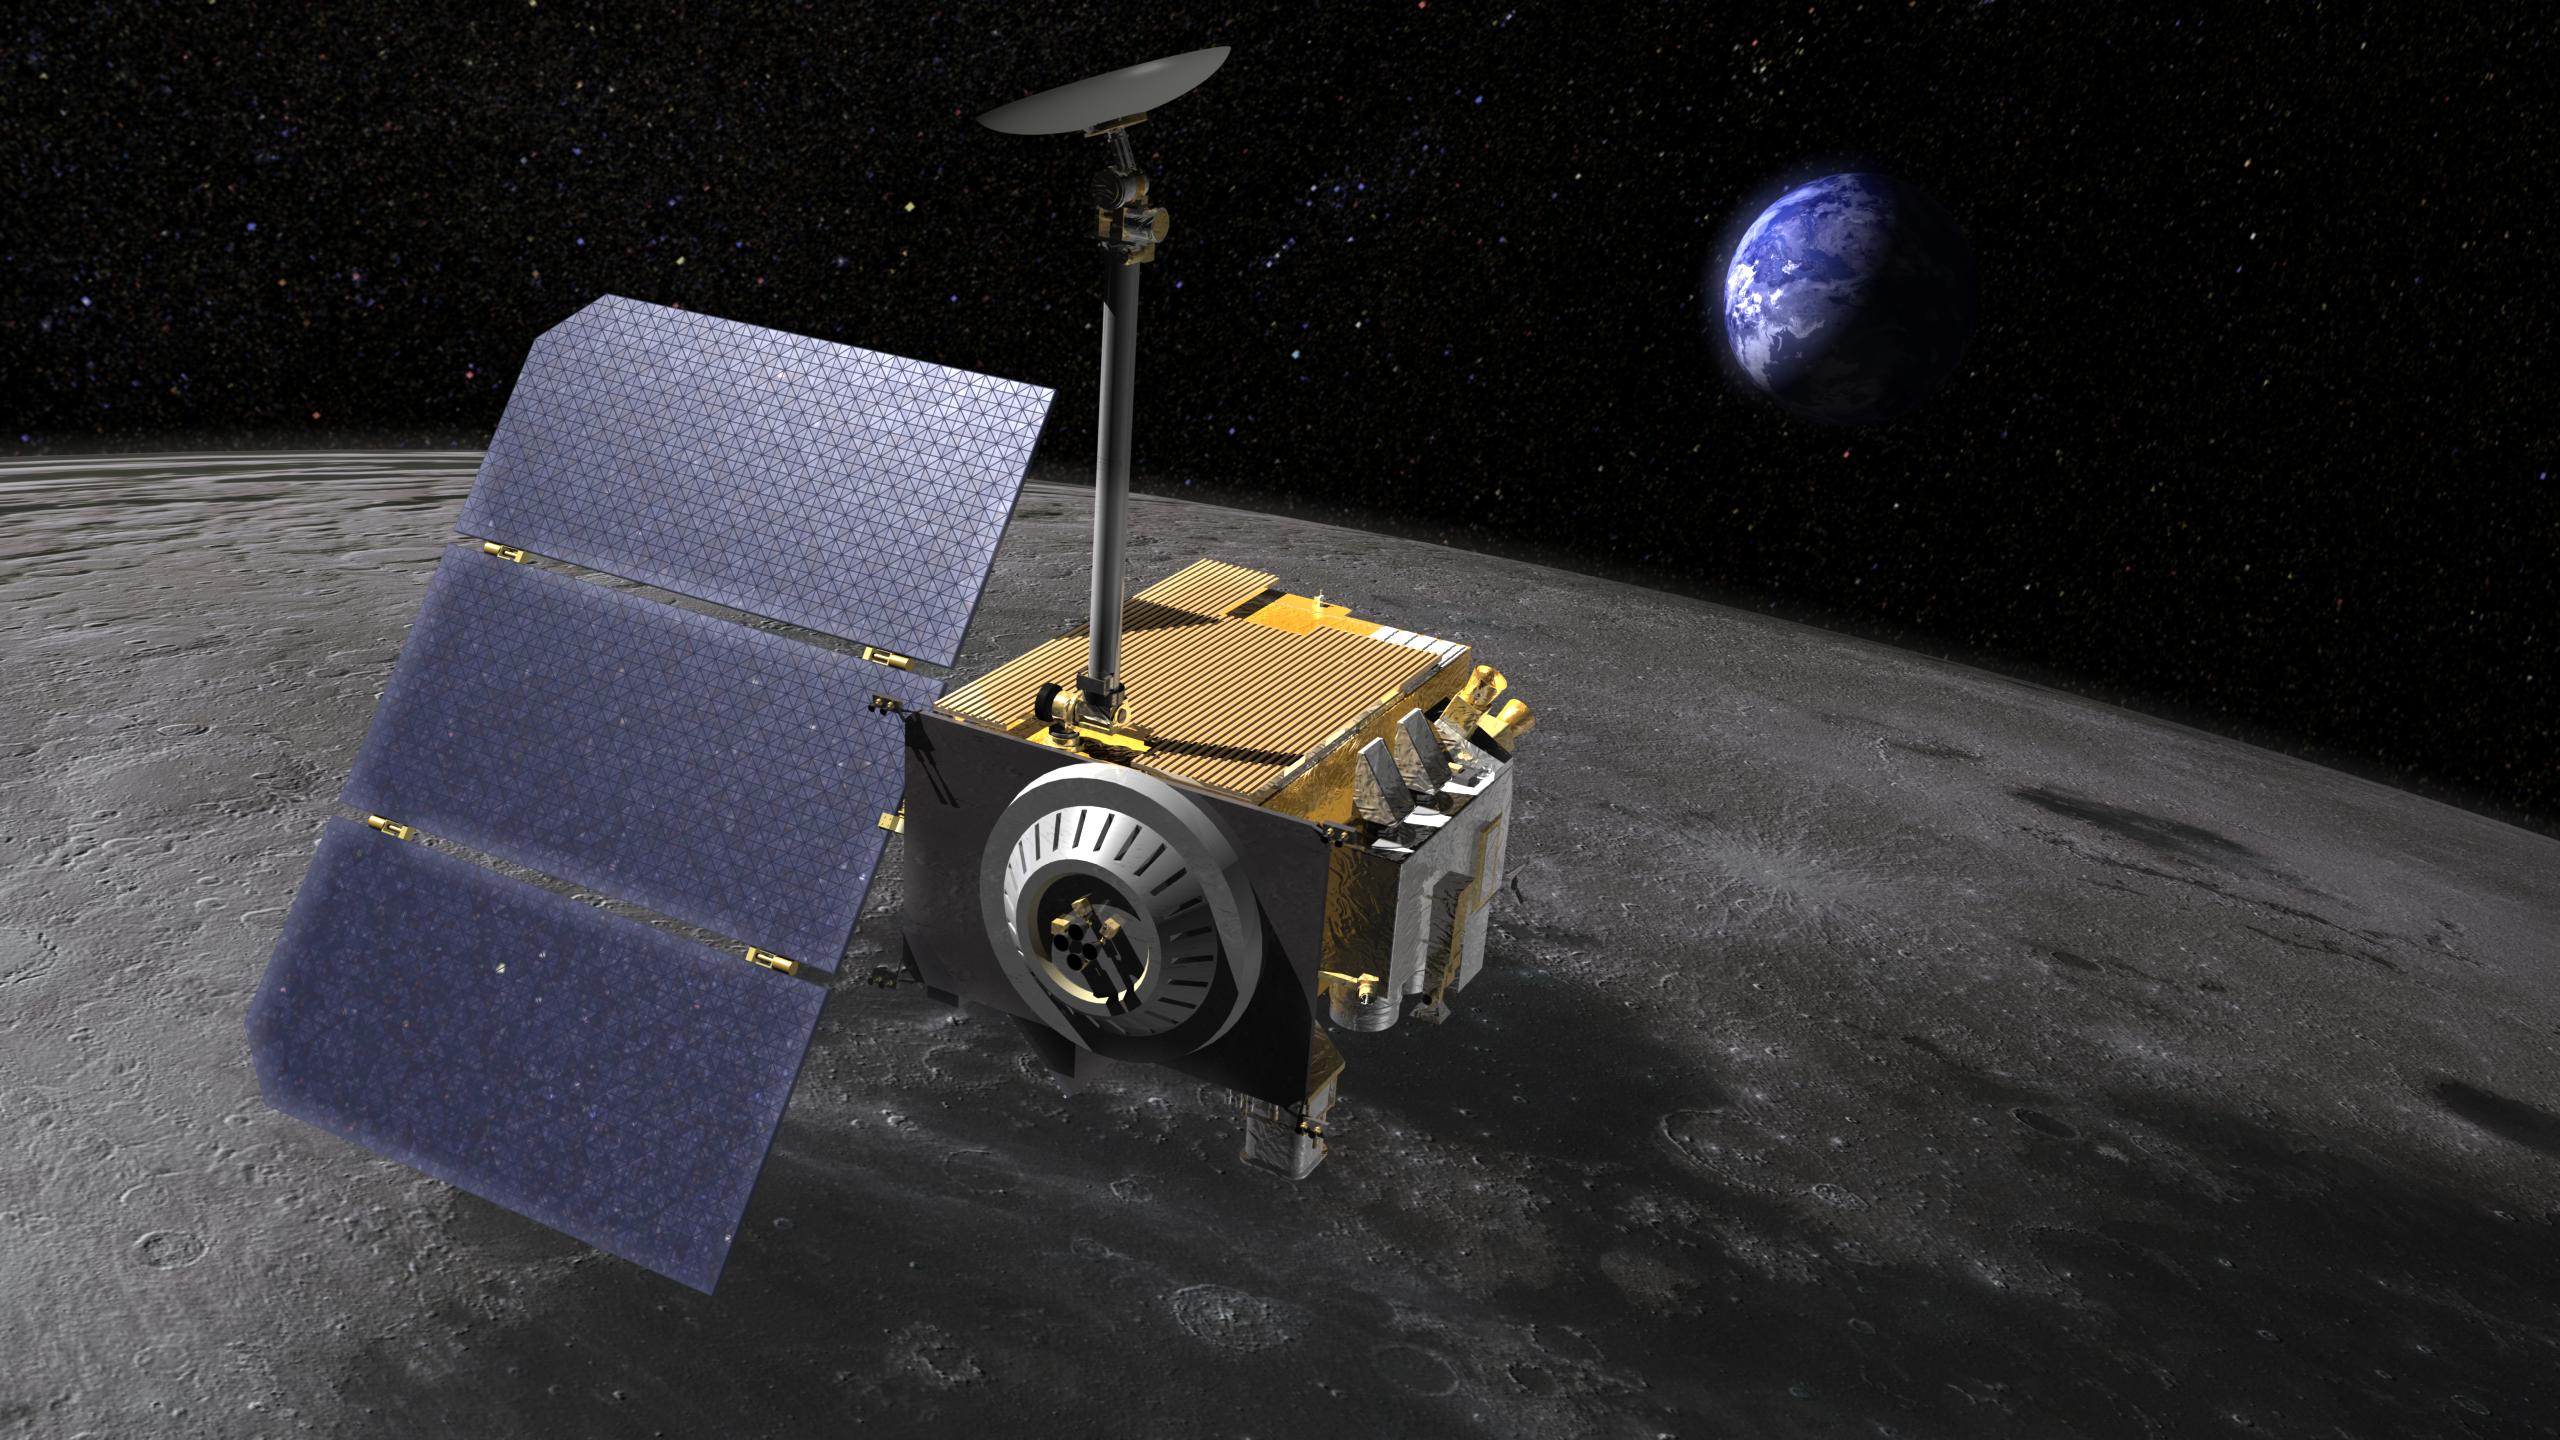
NASA’s Lunar Reconnaissance Orbiter (LRO), launched in 2009, continues to provide data that reshapes our understanding of the Moon. In 2018, scientists analyzing the LRO’s archival data confirmed the presence of water ice in permanently shadowed regions at the Moon’s poles.
In 2024, new studies out of NASA’s Goddard Space Flight Center in Greenbelt, Maryland, showed widespread evidence of water ice within the permanently shadowed regions outside the lunar South Pole, further aiding lunar mission planners. This discovery not only holds implications for lunar exploration but also demonstrates how existing data can yield groundbreaking insights.
NASA’s data archives uncover the secrets of our own planet as well as others. In 2024, archaeologists published a study revealing a “lost” Mayan city in Campeche, Mexico that was previously unknown to the scientific community. The researchers identified the city in archival airborne Earth science data, including a 2013 dataset from NASA Goddard’s LiDAR Hyperspectral & Thermal Imager (G-LiHT) mission.
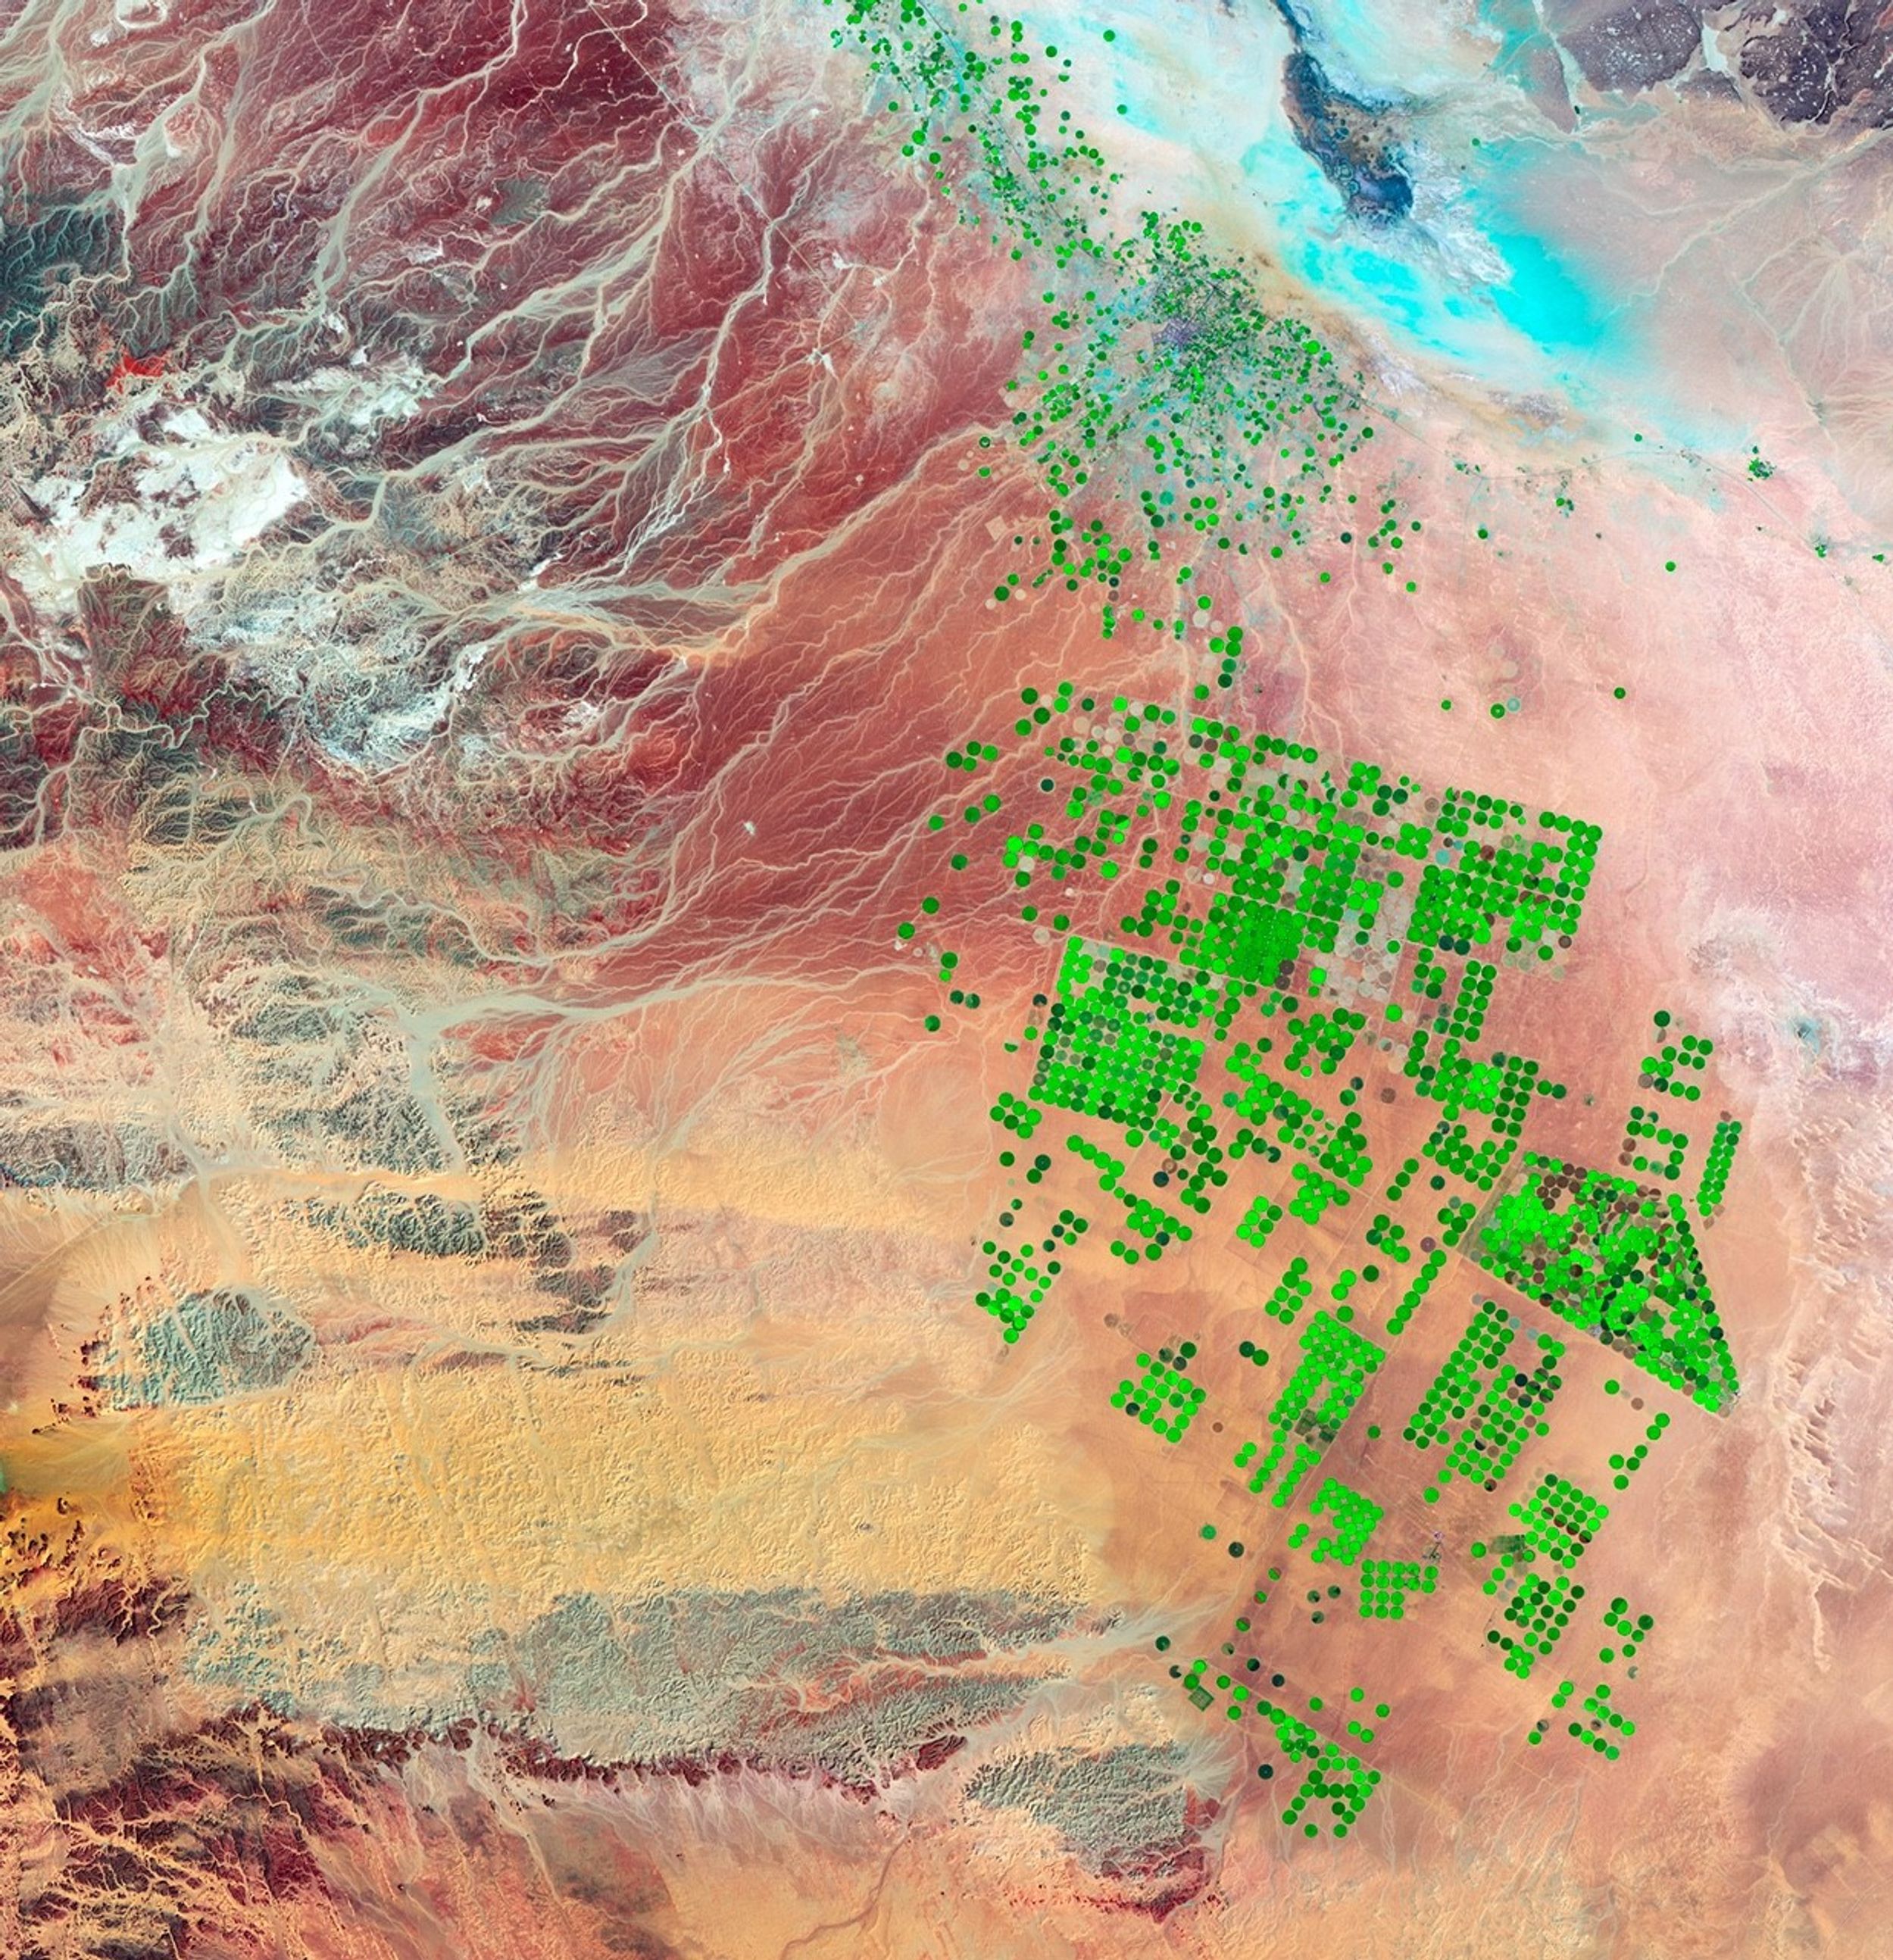
The Harmonized Landsat and Sentinel-2 (HLS) project provides frequent high-resolution observations of Earth’s surface. Data from HLS has been instrumental in tracking urban growth over time. By analyzing changes in land cover, researchers have used HLS to monitor the expansion of cities and infrastructure development. For example, in rapidly growing metropolitan areas, HLS data has revealed patterns of urban sprawl, helping planners analyze past trends to predict future metropolitan expansion.


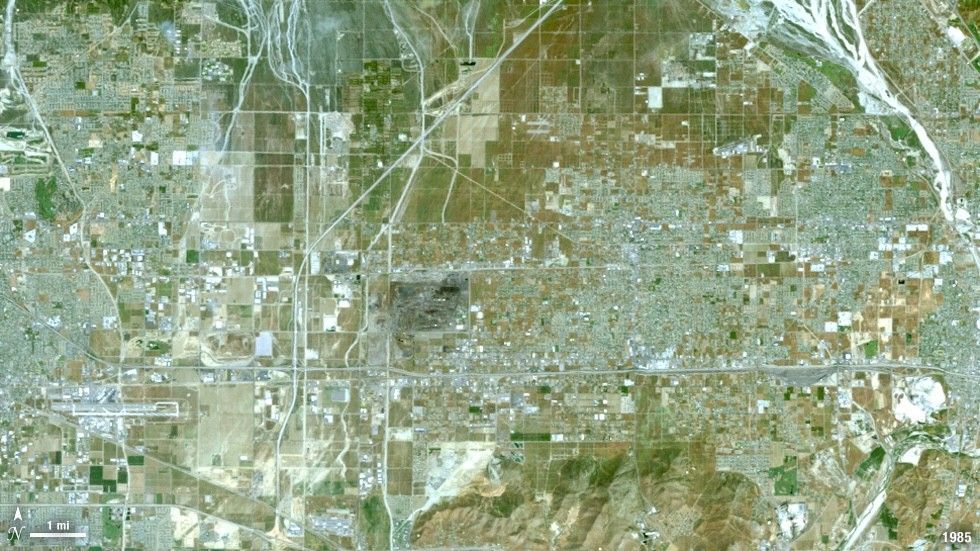
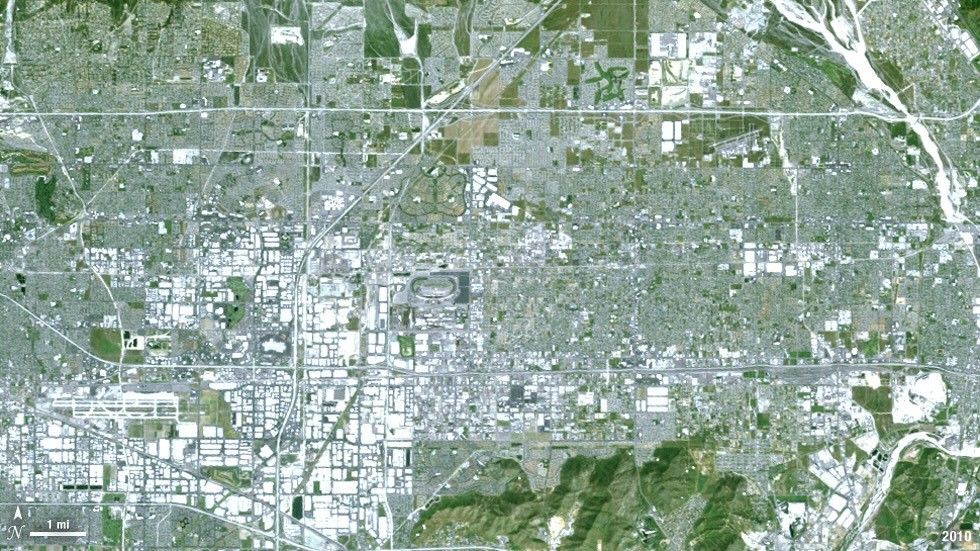
1985
2010
Before and After
Urban Growth in Ontario, California
1985-2010
These discoveries represent only a fraction of what’s possible. NASA is investing in new technologies to harness the full potential of its data archives, including artificial intelligence (AI) foundation models—open-source AI tools designed to extract new findings from existing science data.
“Our vision is to develop at least one AI model for each NASA scientific discipline, turning decades of legacy data into a treasure trove of discovery,” said Murphy. “By embedding NASA expertise into these tools, we ensure that our scientific data continues to drive innovation across science, industry, and society for generations to come.”
Developed under a collaboration between NASA’s Office of the Chief Science Data Officer, IBM, and universities, these AI models are scientifically validated and adaptable to new datasets, making them invaluable for researchers and industries alike.
“It’s like having a virtual assistant that leverages decades of NASA’s knowledge to make smarter, quicker decisions,” said Murphy.
The team’s Earth science foundation models—the Prithvi Geospatial model and Prithvi Weather model—analyze vast datasets to monitor Earth’s changing landscape, track weather patterns, and support critical decision-making processes.
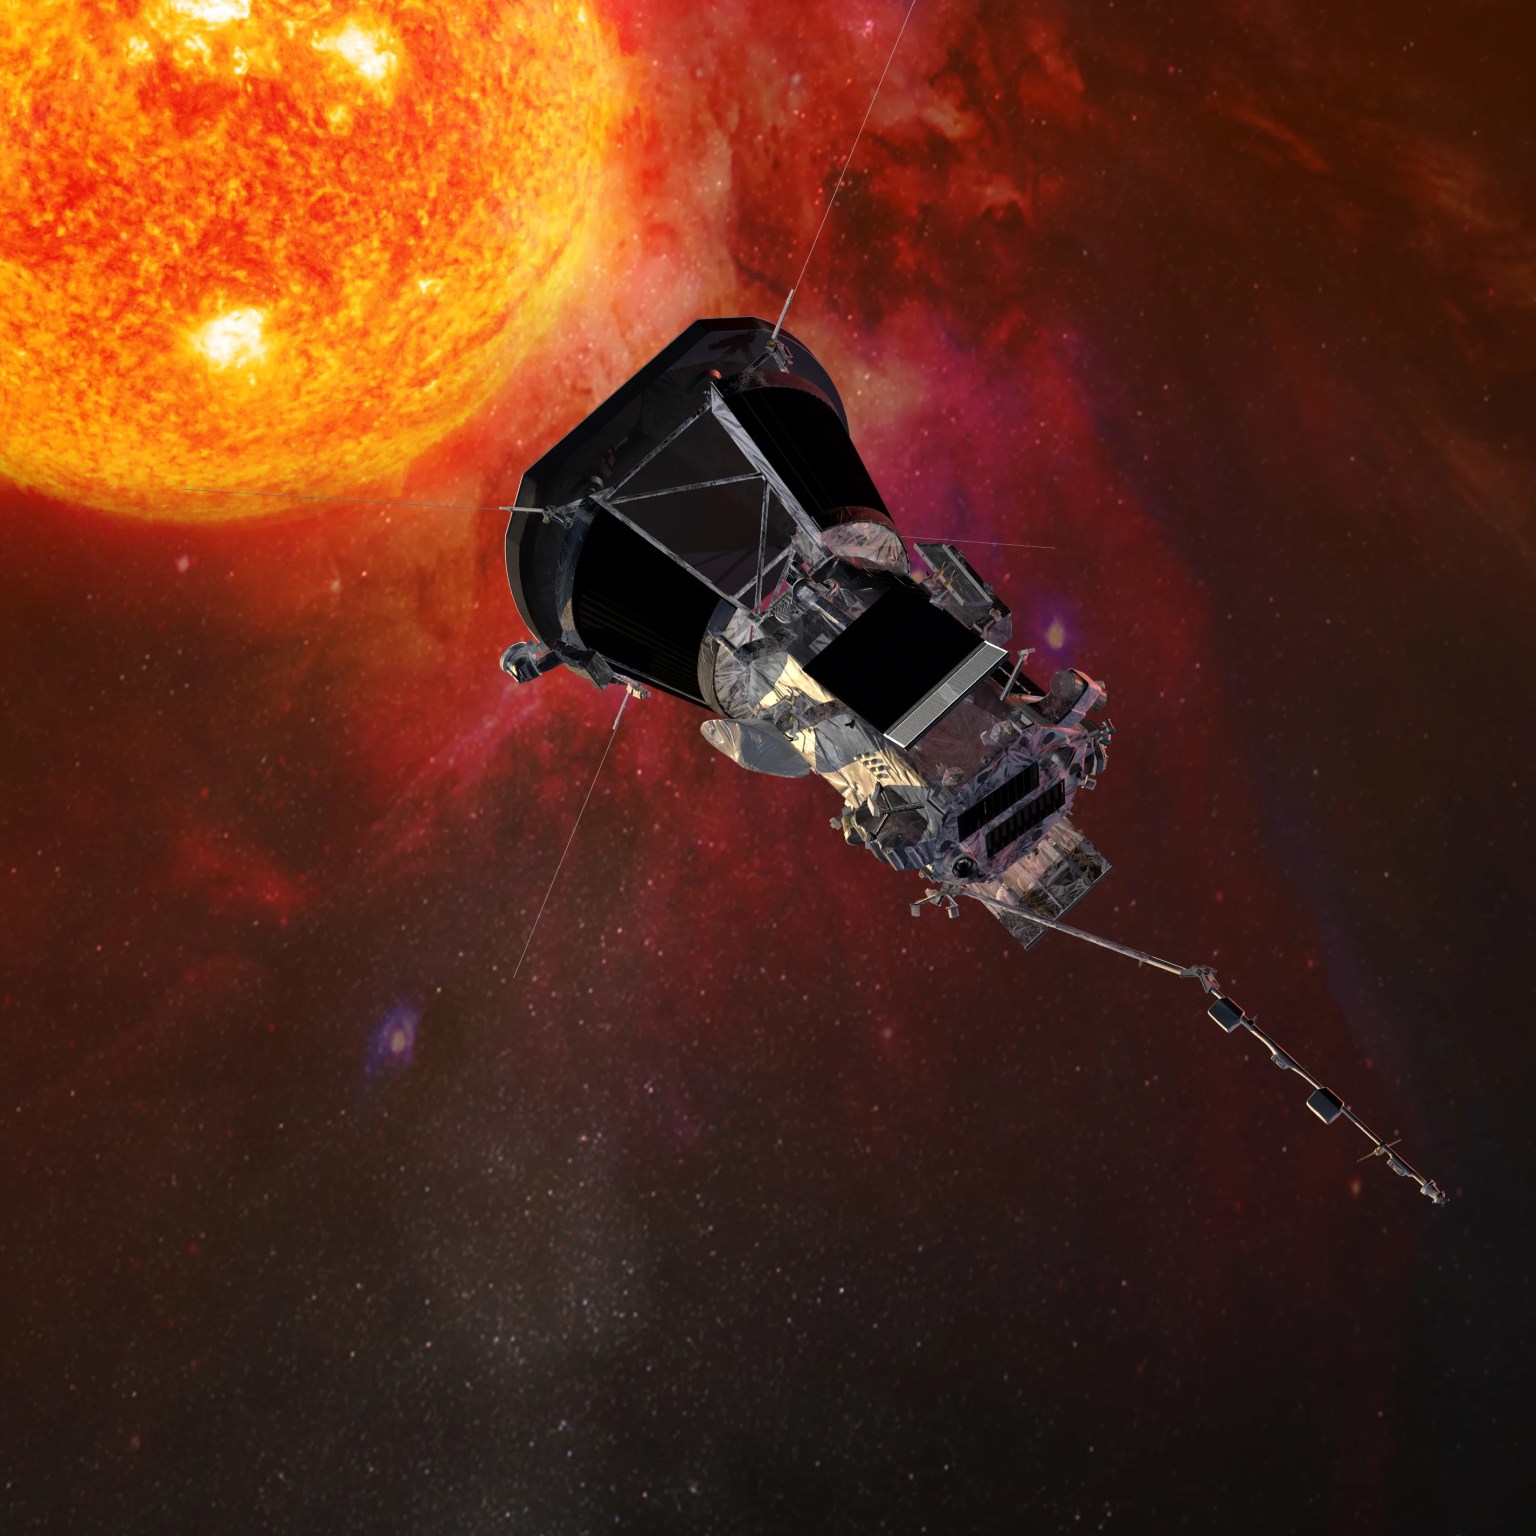
Building on this success, the team is now developing a foundation model for heliophysics. This model will unlock new insights about the dynamics of solar activity and space weather, which can affect satellite operations, communication systems, and even power grids on Earth. Additionally, a model designed for the Moon is in progress, aiming to enhance our understanding of lunar resources and environments.
This investment in AI not only shortens the “data-to-discovery” timeline but also ensures that NASA’s data archives continue to drive innovation. From uncovering new planets to informing future exploration and supporting industries on Earth, the possibilities are boundless.
By maintaining extensive archives and embracing cutting-edge technologies, the agency ensures that the data collected today will continue to inspire and inform discoveries far into the future. In doing so, NASA’s legacy science data truly remains the gift that keeps on giving.
By Amanda Moon Adams
Communications Lead for the Office of the Chief Science Data Officer