


.jpg)


![The breaking news round-up: Decagear launches today, Pimax announces new headsets, and more! [APRIL FOOL’S]](https://i0.wp.com/skarredghost.com/wp-content/uploads/2025/03/lawk_glasses_handson.jpg?fit=1366%2C1025&ssl=1)


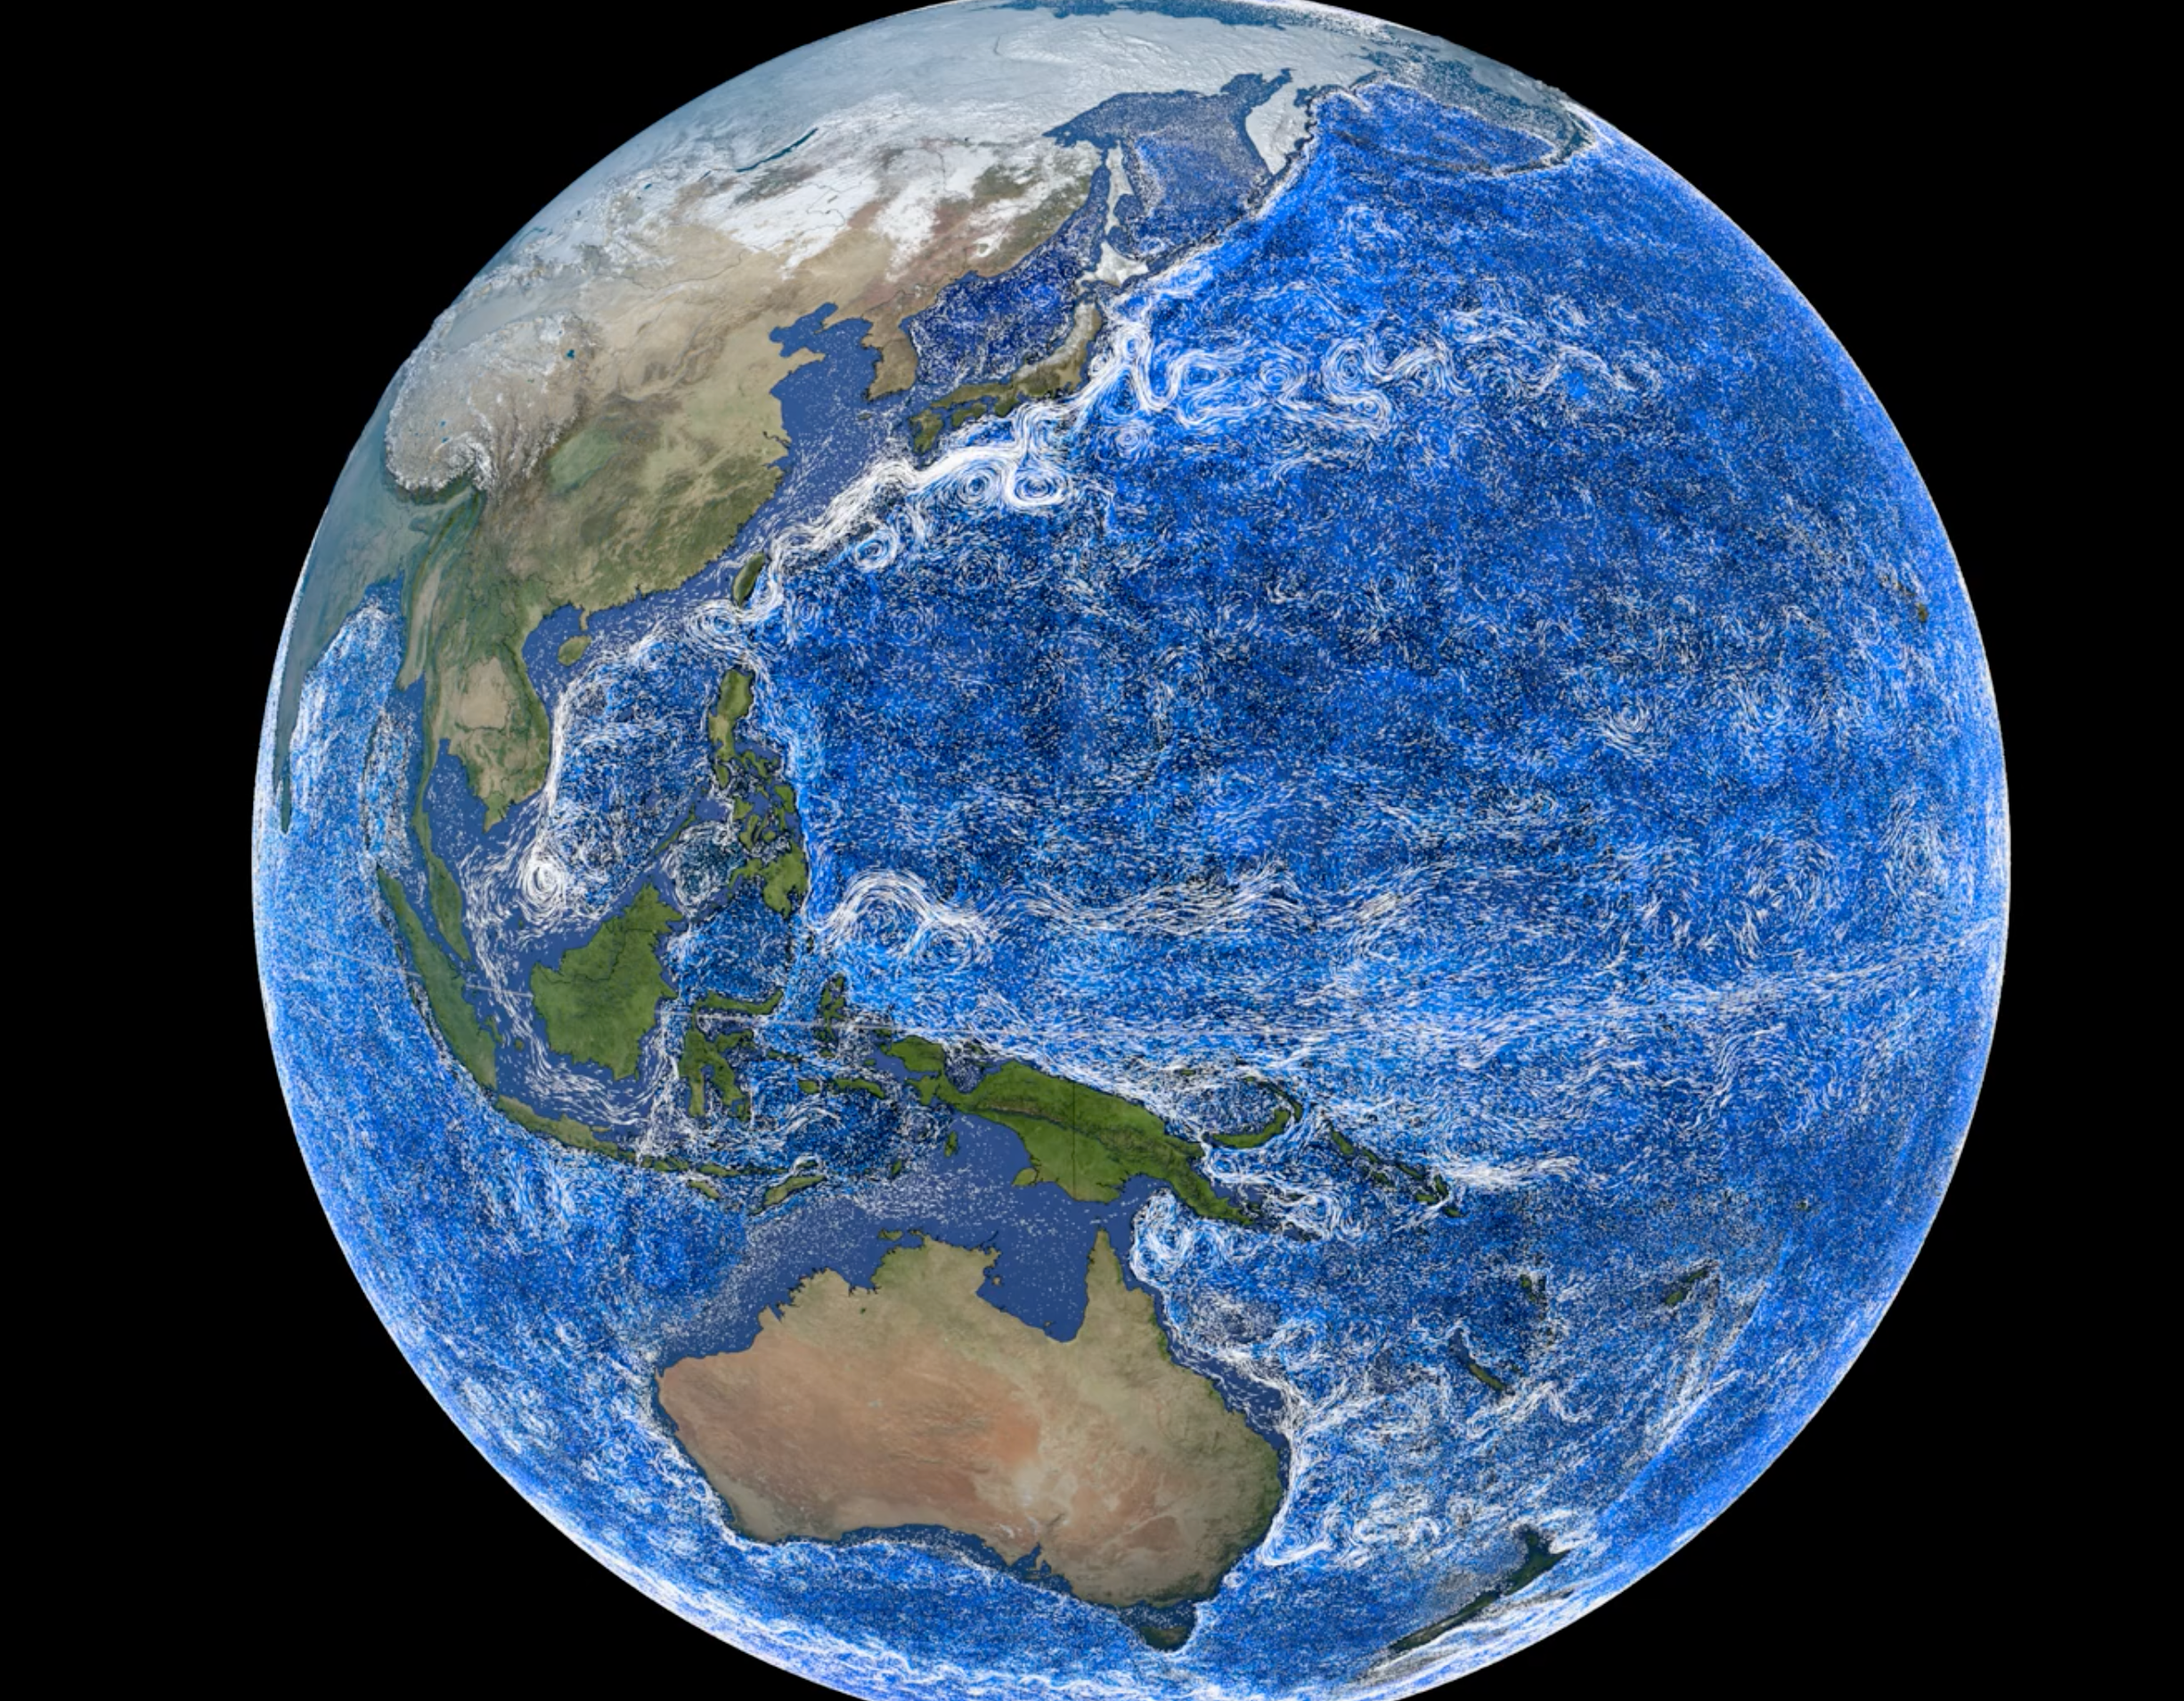
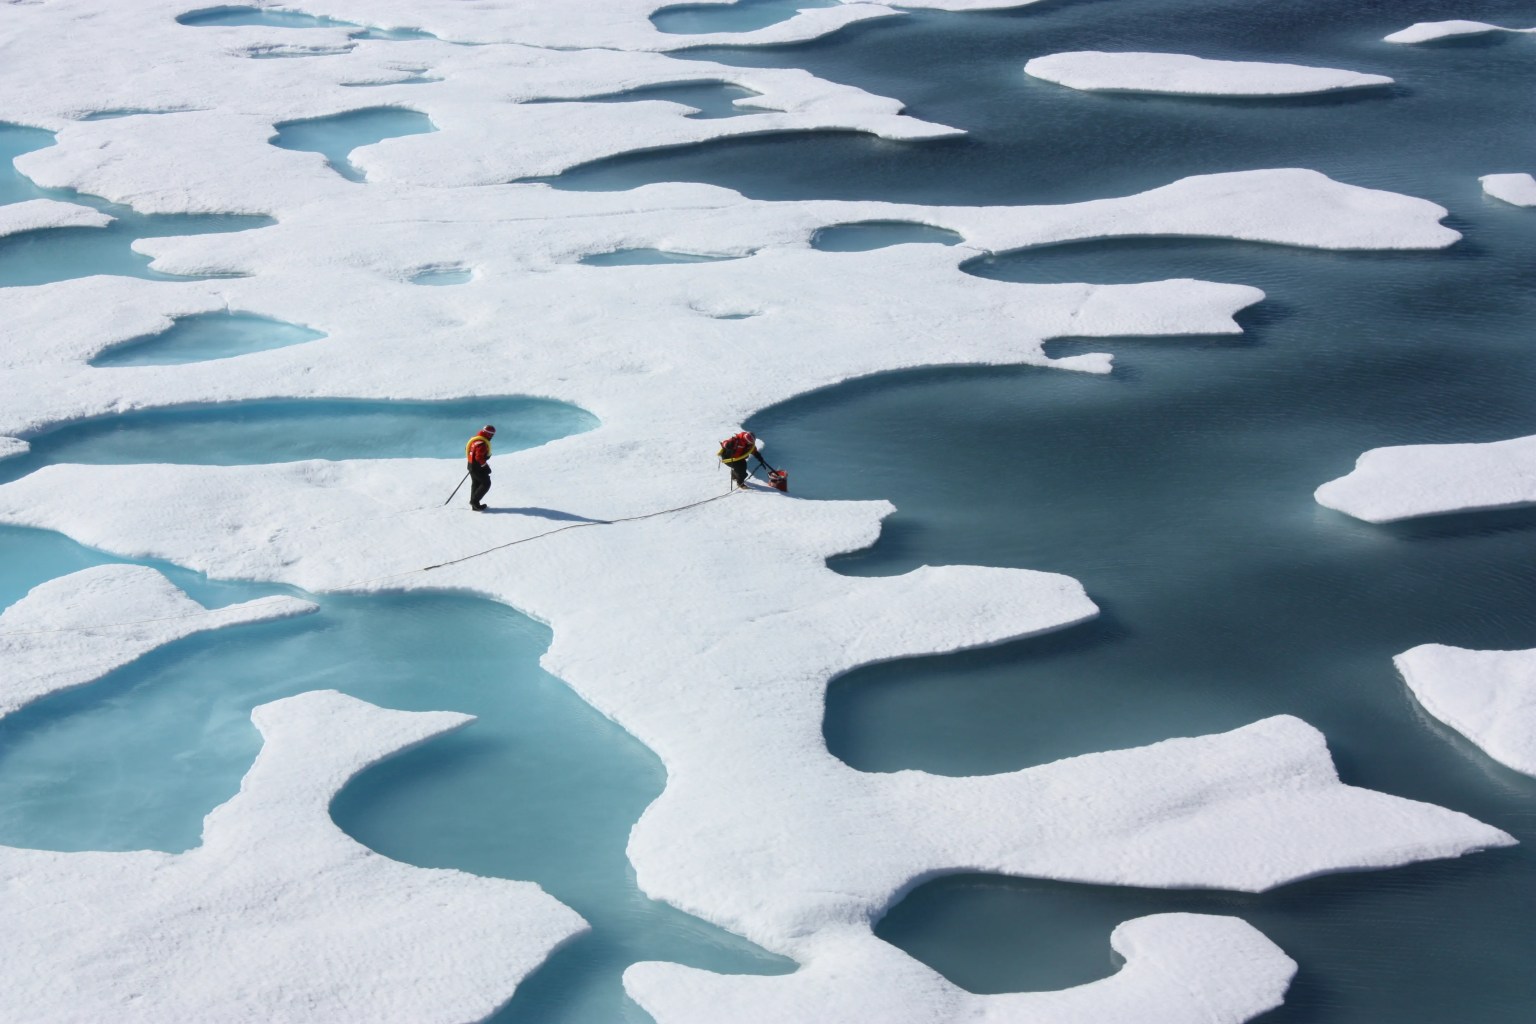
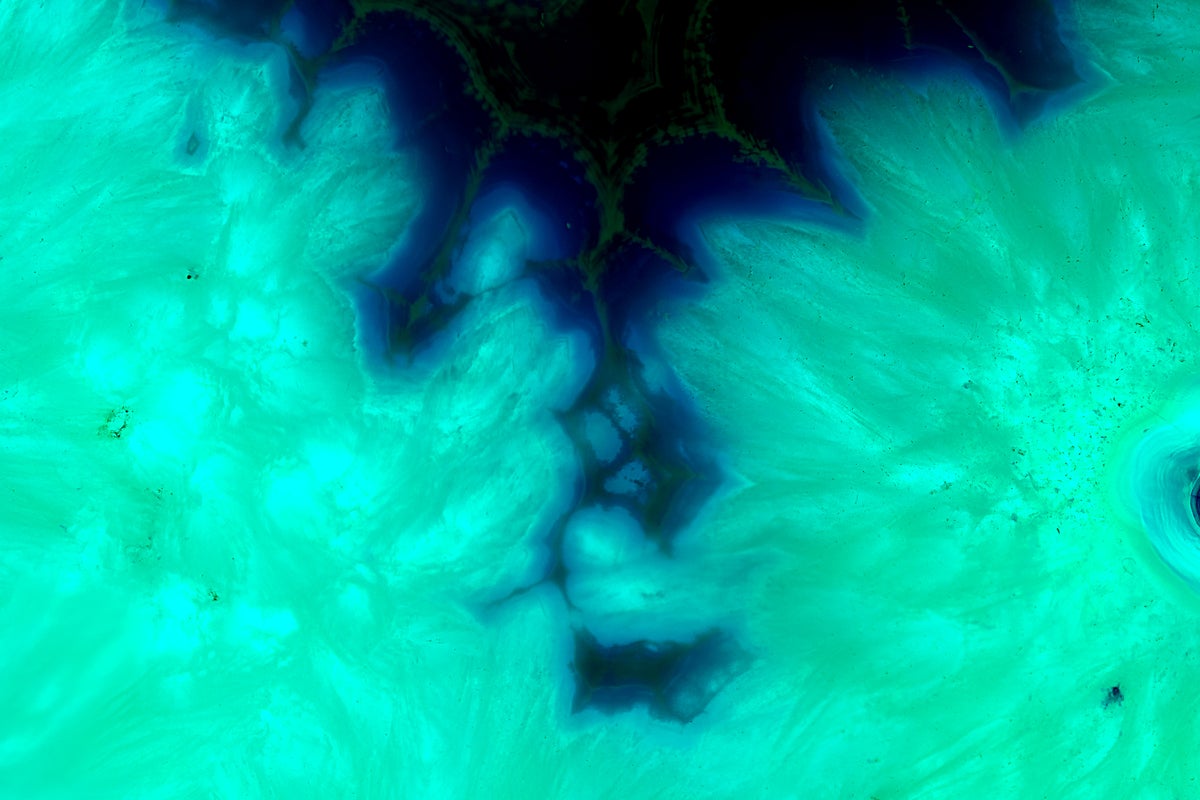
Going With the Flow: Visualizing Ocean Currents with ECCO
NASA scientists and collaborators built the ECCO model to be the most realistic, detailed, and continuous depiction of the ocean ever developed
Going With the Flow: Visualizing Ocean Currents with ECCO
Greg Shirah/NASA’s Scientific Visualization Studio
Historically, the ocean has been difficult to model. Scientists struggled in years past to simulate ocean currents or accurately predict fluctuations in temperature, salinity, and other properties. As a result, models of ocean dynamics rapidly diverged from reality, which meant they could only provide useful information for brief periods.
In 1999, a project called Estimating the Circulation and Climate of the Ocean (ECCO) changed all that. By applying the laws of physics to data from multiple satellites and thousands of floating sensors, NASA scientists and their collaborators built ECCO to be a realistic, detailed, and continuous ocean model that spans decades. ECCO enabled thousands of scientific discoveries, and was featured during the announcement of the Nobel Prize for Physics in 2021.
NASA ECCO is a powerful integrator of decades of ocean data, narrating the story of Earth’s changing ocean as it drives our weather, and sustains marine life.
The ECCO project includes hundreds of millions of real-world measurements of temperature, salinity, sea ice concentration, pressure, water height, and flow in the world’s oceans. Researchers rely on the model output to study ocean dynamics and to keep tabs on conditions that are crucial for ecosystems and weather patterns. The modeling effort is supported by NASA’s Earth science programs and by the international ECCO consortium, which includes researchers from NASA’s Jet Propulsion Laboratory in Southern California and eight research institutions and universities.
The project provides models that are the best possible reconstruction of the past 30 years of the global ocean. It allows us to understand the ocean’s physical processes at scales that are not normally observable.
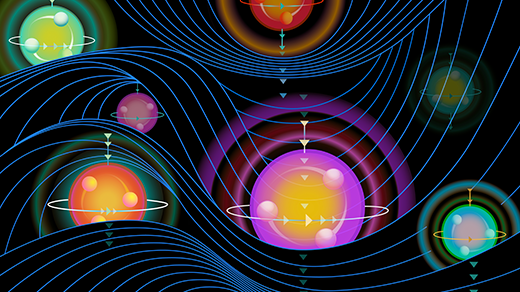
ECCO and the Western Boundary Currents
Large-scale wind patterns around the globe drag ocean surface waters with them, creating complex currents, including some that flow toward the western sides of the ocean basins. The currents hug the eastern coasts of continents as they head north or south from the equator: These are the western boundary currents. The three most prominent are the Gulf Stream, Agulhas, and Kuroshio. NASA Goddard’s Scientific Visualization Studio.
Seafarers have known about the Gulf Stream — the Atlantic Ocean’s western boundary current — for more than 500 years. By the volume of water it moves, the Gulf Stream is the largest of the western boundary currents, transporting more water than all the planet’s rivers combined.
In 1785, Benjamin Franklin added it to maritime charts showing the current flowing up from the Gulf, along the eastern U.S. coast, and out across the North Atlantic. Franklin noted that riding the current could improve a ship’s travel time from the Americas to Europe, while avoiding the current could shorten travel times when sailing back.
Franklin’s charts showed a smooth Gulf Stream rather than the twisted, swirling path revealed in ECCO data. And Franklin couldn’t have imagined the opposing flow of water below the Gulf Stream. The countercurrent runs at depths of about 2,000 feet (600 meters) in a cold river of water that is roughly the opposite of the warm Gulf Stream at the surface. The submarine countercurrent is clearly visible when the upper layers in the ECCO model are peeled away in visualizations.
The Gulf Stream is a part of the Atlantic Meridional Overturning Circulation (AMOC), which moderates climate worldwide by transporting warm surface waters north and cool underwater currents south. The Gulf Stream, in particular, stabilizes temperatures of the southeastern United States, keeping the region warmer in winter and cooler in summer than it would be without the current. After the Gulf Stream crosses the Atlantic, it tempers the climates of England and the European coast as well.
The Agulhas Current flows south along the western side of the Indian Ocean. When it reaches the southern tip of Africa, it sheds swirling vortices of water called Agulhas Rings. Sometimes persisting for years, the rings glide across the Atlantic toward South America, transporting small fish, larvae, and other microorganisms from the Indian Ocean.
Researchers using the ECCO model can study Agulhas Current flow as it sends warm, salty water from the tropics in the Indian Ocean toward the tip of South Africa. The model helps tease out the complicated dynamics that create the Agulhas rings and large loop of current called a supergyre that surrounds the Antarctic. The Southern Hemisphere supergyre links the southern portions of other, smaller current loops (gyres) that circulate in the southern Atlantic, Pacific, and Indian oceans. Together with gyres in the northern Atlantic and Pacific, the southern gyres and Southern Hemisphere supergyre influence climate while transporting carbon around the globe.
In addition to affecting global weather patterns and temperatures, western boundary currents can drive vertical flows in the oceans known as upwellings. The flows bring nutrients up from the depths to the surface, where they act as fertilizer for phytoplankton, algae, and aquatic plants.
The Kuroshio Current that runs on the west side of the Pacific Ocean and along the east side of Japan has recently been associated with upwellings that enrich coastal fishing waters. The specific mechanisms that cause the vertical flows are not entirely clear. Ocean scientists are now turning to ECCO to tease out the connection between nutrient transport and currents like the Kuroshio that might be revealed in studies of the water temperature, density, pressure, and other factors included in the ECCO model.
Tracking Ocean Temperatures and Salinity
When viewed through the lens of ECCO’s temperature data, western boundary currents carry warm water away from the tropics and toward the poles. In the case of the Gulf Stream, as the current moves to far northern latitudes, some of the saltwater freezes into salt-free sea ice. The saltier water left behind sinks and then flows south all the way toward the Antarctic before rising and warming in other ocean basins.
Currents also move nutrients and salt throughout Earth’s ocean basins. Swirling vortexes of the Agulhas rings stand out in ECCO temperature and salinity maps as they move warm, salty water from the Indian Ocean into the Atlantic.
Experimenting with ECCO
ECCO offers researchers a way to run virtual experiments that would be impractical or too costly to perform in real oceans. Some of the most important applications of the ECCO model are in ocean ecology, biology, and chemistry. Because the model shows where the water comes from and where it goes, researchers can see how currents transport heat, minerals, nutrients, and organisms around the planet.
In prior decades, for example, ocean scientists relied on extensive temperature and salinity measurements by floating sensors to deduce that the Gulf Stream is primarily made of water flowing past the Gulf rather than through it. The studies were time-consuming and expensive. With the ECCO model, data visualizers at NASA’s Goddard Space Flight Center in Greenbelt, Maryland, virtually replicated the research in a simulation that was far quicker and cheaper.
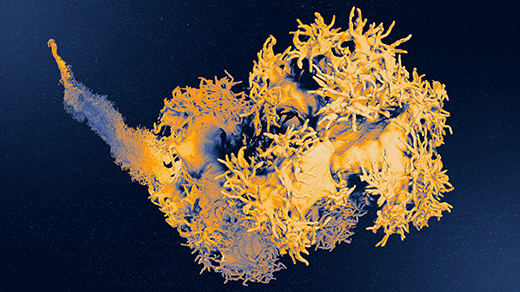
Download this visualization from NASA Goddard’s Scientific Visualization Studio.
The example illustrated here relies on ECCO to track the flow of water by virtually filling the Gulf with 115,000 particles and letting them move for a year in the model. The demonstration showed that less than 1% of the particles escape the Gulf to join the Gulf Stream.
Running such particle-tracking experiments within the ocean circulation models helps scientists understand how and where environmental contaminants, such as oil spills, can spread.
Take an ECCO Deep Dive
Today, researchers turn to ECCO for a broad array of studies. They can choose ECCO modeling products that focus on one feature – such as global flows or the biology and chemistry of the ocean – or they can narrow the view to the poles or specific ocean regions. Every year, more than a hundred scientific papers include data and analyses from the ECCO model that delve into our oceans’ properties and dynamics.
Composed by James Riordon / NASA’s Earth Science News Team
Information in this piece came from the resources below and interviews with the following sources: Nadya Vinogradova Shiffer, Dimitris Menemenlis, Ian Fenty, and Atousa Saberi.
References and Sources
Liao, F., Liang, X., Li, Y., & Spall, M. (2022). Hidden upwelling systems associated with major western boundary currents. Journal of Geophysical Research: Oceans, 127(3), e2021JC017649.
Richardson, P. L. (1980). The Benjamin Franklin and Timothy Folger charts of the Gulf Stream. In Oceanography: The Past: Proceedings of the Third International Congress on the History of Oceanography, held September 22–26, 1980 at the Woods Hole Oceanographic Institution, Woods Hole, Massachusetts, USA on the occasion of the Fiftieth Anniversary of the founding of the Institution (pp. 703-717). New York, NY: Springer New York.
Biastoch, A., Rühs, S., Ivanciu, I., Schwarzkopf, F. U., Veitch, J., Reason, C., … & Soltau, F. (2024). The Agulhas Current System as an Important Driver for Oceanic and Terrestrial Climate. In Sustainability of Southern African Ecosystems under Global Change: Science for Management and Policy Interventions (pp. 191-220). Cham: Springer International Publishing.
Lee-Sánchez, E., Camacho-Ibar, V. F., Velásquez-Aristizábal, J. A., Valencia-Gasti, J. A., & Samperio-Ramos, G. (2022). Impacts of mesoscale eddies on the nitrate distribution in the deep-water region of the Gulf of Mexico. Journal of Marine Systems, 229, 103721.