Strobelight: A profiling service built on open source technology
We’re sharing details about Strobelight, Meta’s profiling orchestrator. Strobelight combines several technologies, many open source, into a single service that helps engineers at Meta improve efficiency and utilization across our fleet. Using Strobelight, we’ve seen significant efficiency wins, including one that has resulted in an estimated 15,000 servers’ worth of annual capacity savings. Strobelight, Meta’s [...] Read More... The post Strobelight: A profiling service built on open source technology appeared first on Engineering at Meta.

- We’re sharing details about Strobelight, Meta’s profiling orchestrator.
- Strobelight combines several technologies, many open source, into a single service that helps engineers at Meta improve efficiency and utilization across our fleet.
- Using Strobelight, we’ve seen significant efficiency wins, including one that has resulted in an estimated 15,000 servers’ worth of annual capacity savings.
Strobelight, Meta’s profiling orchestrator, is not really one technology. It’s several (many open source) combined to make something that unlocks truly amazing efficiency wins. Strobelight is also not a single profiler but an orchestrator of many different profilers (even ad-hoc ones) that runs on all production hosts at Meta, collecting detailed information about CPU usage, memory allocations, and other performance metrics from running processes. Engineers and developers can use this information to identify performance and resource bottlenecks, optimize their code, and improve utilization.
When you combine talented engineers with rich performance data you can get efficiency wins by both creating tooling to identify issues before they reach production and finding opportunities in already running code. Let’s say an engineer makes a code change that introduces an unintended copy of some large object on a service’s critical path. Meta’s existing tools can identify the issue and query Strobelight data to estimate the impact on compute cost. Then Meta’s code review tool can notify the engineer that they’re about to waste, say, 20,000 servers.
Of course, static analysis tools can pick up on these sorts of issues, but they are unaware of global compute cost and oftentimes these inefficiencies aren’t a problem until they’re gradually serving millions of requests per minute. The frog can boil slowly.
Why do we use profilers?
Profilers operate by sampling data to perform statistical analysis. For example, a profiler takes a sample every N events (or milliseconds in the case of time profilers) to understand where that event occurs or what is happening at the moment of that event. With a CPU-cycles event, for example, the profile will be CPU time spent in functions or function call stacks executing on the CPU. This can give an engineer a high-level understanding of the code execution of a service or binary.
Choosing your own adventure with Strobelight
There are other daemons at Meta that collect observability metrics, but Strobelight’s wheelhouse is software profiling. It connects resource usage to source code (what developers understand best). Strobelight’s profilers are often, but not exclusively, built using eBPF, which is a Linux kernel technology. eBPF allows the safe injection of custom code into the kernel, which enables very low overhead collection of different types of data and unlocks so many possibilities in the observability space that it’s hard to imagine how Strobelight would work without it.
As of the time of writing this, Strobelight has 42 different profilers, including:
- Memory profilers powered by jemalloc.
- Function call count profilers.
- Event-based profilers for both native and non-native languages (e.g., Python, Java, and Erlang).
- AI/GPU profilers.
- Profilers that track off-CPU time.
- Profilers that track service request latency.
Engineers can utilize any one of these to collect data from servers on demand via Strobelight’s command line tool or web UI.
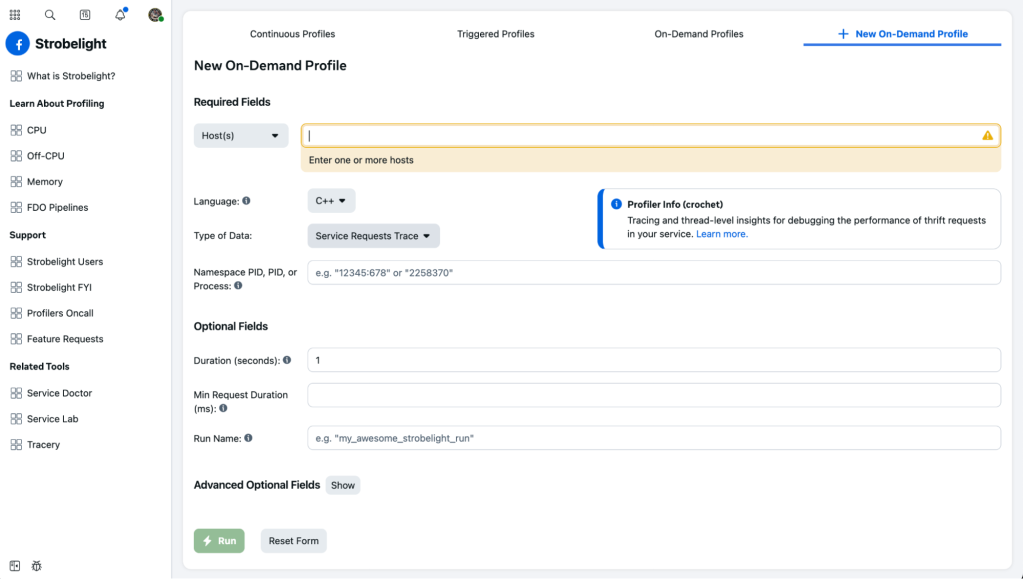
Users also have the ability to set up continuous or “triggered” profiling for any of these profilers by updating a configuration file in Meta’s Configerator, allowing them to target their entire service or, for example, only hosts that run in certain regions. Users can specify how often these profilers should run, the run duration, the symbolization strategy, the process they want to target, and a lot more.
Here is an example of a simple configuration for one of these profilers:
add_continuous_override_for_offcpu_data(
    "my_awesome_team", // the team that owns this service
    Type.SERVICE_ID,
    "my_awseome_service",
    30_000, // desired samples per hour
)
Why does Strobelight have so many profilers? Because there are so many different things happening in these systems powered by so many different technologies.
This is also why Strobelight provides ad-hoc profilers. Since the kind of data that can be gathered from a binary is so varied, engineers often need something that Strobelight doesn’t provide out of the box. Adding a new profiler from scratch to Strobelight involves several code changes and could take several weeks to get reviewed and rolled out.
However, engineers can write a single bpftrace script (a simple language/tool that allows you to easily write eBPF programs) and tell Strobelight to run it like it would any other profiler. An engineer that really cares about the latency of a particular C++ function, for example, could write up a little bpftrace script, commit it, and have Strobelight run it on any number of hosts throughout Meta’s fleet – all within a matter of hours, if needed.
If all of this sounds powerfully dangerous, that’s because it is. However, Strobelight has several safeguards in place to prevent users from causing performance degradation for the targeted workloads and retention issues for the databases Strobelight writes to. Strobelight also has enough awareness to ensure that different profilers don’t conflict with each other. For example, if a profiler is tracking CPU cycles, Strobelight ensures another profiler can’t use another PMU counter at the same time (as there are other services that also use them).
Strobelight also has concurrency rules and a profiler queuing system. Of course, service owners still have the flexibility to really hammer their machines if they want to extract a lot of data to debug.
Default data for everyone
Since its inception, one of Strobelight’s core principles has been to provide automatic, regularly-collected profiling data for all of Meta’s services. It’s like a flight recorder – something that doesn’t have to be thought about until it’s needed. What’s worse than waking up to an alert that a service is unhealthy and there is no data as to why?
For that reason, Strobelight has a handful of curated profilers that are configured to run automatically on every Meta host. They’re not running all the time; that would be “bad” and not really “profiling.” Instead, they have custom run intervals and sampling rates specific to the workloads running on the host. This provides just the right amount of data without impacting the profiled services or overburdening the systems that store Strobelight data.
Here is an example:
A service, named Soft Server, runs on 1,000 hosts and let’s say we want profiler A to gather 40,000 CPU-cycles samples per hour for this service (remember the config above). Strobelight, knowing how many hosts Soft Server runs on, but not how CPU intensive it is, will start with a conservative run probability, which is a sampling mechanism to prevent bias (e.g., profiling these hosts at noon every day would hide traffic patterns).
The next day Strobelight will look at how many samples it was able to gather for this service and then automatically tune the run probability (with some very simple math) to try to hit 40,000 samples per hour. We call this dynamic sampling and Strobelight does this readjustment every day for every service at Meta.
And if there is more than one service running on the host (excluding daemons like systemd or Strobelight) then Strobelight will default to using the configuration that will yield more samples for both.
Hang on, hang on. If the run probability or sampling rate is different depending on the host for a service, then how can the data be aggregated or compared across the hosts? And how can profiling data for multiple services be compared?
Since Strobelight is aware of all these different knobs for profile tuning, it adjusts the “weight” of a profile sample when it’s logged. A sample’s weight is used to normalize the data and prevent bias when analyzing or viewing this data in aggregate. So even if Strobelight is profiling Soft Server less often on one host than on another, the samples can be accurately compared and grouped. This also works for comparing two different services since Strobelight is used both by service owners looking at their specific service as well as efficiency experts who look for “horizontal” wins across the fleet in shared libraries.
How Strobelight saves capacity
There are two default continuous profilers that should be called out because of how much they end up saving in capacity.
The last branch record (LBR) profiler
The LBR profiler, true to its name, is used to sample last branch records (a hardware feature that started on Intel). The data from this profiler doesn’t get visualized but instead is fed into Meta’s feedback directed optimization (FDO) pipeline. This data is used to create FDO profiles that are consumed at compile time (CSSPGO) and post-compile time (BOLT) to speed up binaries through the added knowledge of runtime behavior. Meta’s top 200 largest services all have FDO profiles from the LBR data gathered continuously across the fleet. Some of these services see up to 20% reduction in CPU cycles, which equates to a 10-20% reduction in the number of servers needed to run these services at Meta.
The event profiler
The second profiler is Strobelight’s event profiler. This is Strobelight’s version of the Linux perf tool. Its primary job is to collect user and kernel stack traces from multiple performance (perf) events e.g., CPU-cycles, L3 cache misses, instructions, etc. Not only is this data looked at by individual engineers to understand what the hottest functions and call paths are, but this data is also fed into monitoring and testing tools to identify regressions; ideally before they hit production.
Did someone say Meta…data?
Looking at function call stacks with flame graphs is great, nothing against it. But a service owner looking at call stacks from their service, which imports many libraries and utilizes Meta’s software frameworks, will see a lot of “foreign” functions. Also, what about finding just the stacks for p99 latency requests? Or how about all the places where a service is making an unintended string copy?
Stack schemas
Strobelight has multiple mechanisms for enhancing the data it produces according to the needs of its users. One such mechanism is called Stack Schemas (inspired by Microsoft’s stack tags), which is a small DSL that operates on call stacks and can be used to add tags (strings) to entire call stacks or individual frames/functions. These tags can then be utilized in our visualization tool. Stack Schemas can also remove functions users don’t care about with regex matching. Any number of schemas can be applied on a per-service or even per-profile basis to customize the data.
There are even folks who create dashboards from this metadata to help other engineers identify expensive copying, use of inefficient or inappropriate C++ containers, overuse of smart pointers, and much more. Static analysis tools that can do this have been around for a long time, but they can’t pinpoint the really painful or computationally expensive instances of these issues across a large fleet of machines.
Strobemeta
Strobemeta is another mechanism, which utilizes thread local storage, to attach bits of dynamic metadata at runtime to call stacks that we gather in the event profiler (and others). This is one of the biggest advantages of building profilers using eBPF: complex and customized actions taken at sample time. Collected Strobemeta is used to attribute call stacks to specific service endpoints, or request latency metrics, or request identifiers. Again, this allows engineers and tools to do more complex filtering to focus the vast amounts of data that Strobelight profilers produce.
Symbolization
Now is a good time to talk about symbolization: taking the virtual address of an instruction, converting it into an actual symbol (function) name, and, depending on the symbolization strategy, also getting the function’s source file, line number, and type information.
Most of the time getting the whole enchilada means using a binary’s DWARF debug info. But this can be many megabytes (or even gigabytes) in size because DWARF debug data contains much more than the symbol information.
This data needs to be downloaded then parsed. But attempting this while profiling, or even afterwards on the same host where the profile is gathered, is far too computationally expensive. Even with optimal caching strategies it can cause memory issues for the host’s workloads.
Strobelight gets around this problem via a symbolization service that utilizes several open source technologies including DWARF, ELF, gsym, and blazesym. At the end of a profile Strobelight sends stacks of binary addresses to a service that sends back symbolized stacks with file, line, type info, and even inline information.
It can do this because it has already done all the heavy lifting of downloading and parsing the DWARF data for each of Meta’s binaries (specifically, production binaries) and stores what it needs in a database. Then it can serve multiple symbolization requests coming from different instances of Strobelight running throughout the fleet.
To add to that enchilada (hungry yet?), Strobelight also delays symbolization until after profiling and stores raw data to disk to prevent memory thrash on the host. This has the added benefit of not letting the consumer impact the producer – meaning if Strobelight’s user space code can’t handle the speed at which the eBPF kernel code is producing samples (because it’s spending time symbolizing or doing some other processing) it results in dropped samples.
All of this is made possible with the inclusion of frame pointers in all of Meta’s user space binaries, otherwise we couldn’t walk the stack to get all these addresses (or we’d have to do some other complicated/expensive thing which wouldn’t be as efficient).

Show me the data (and make it nice)!
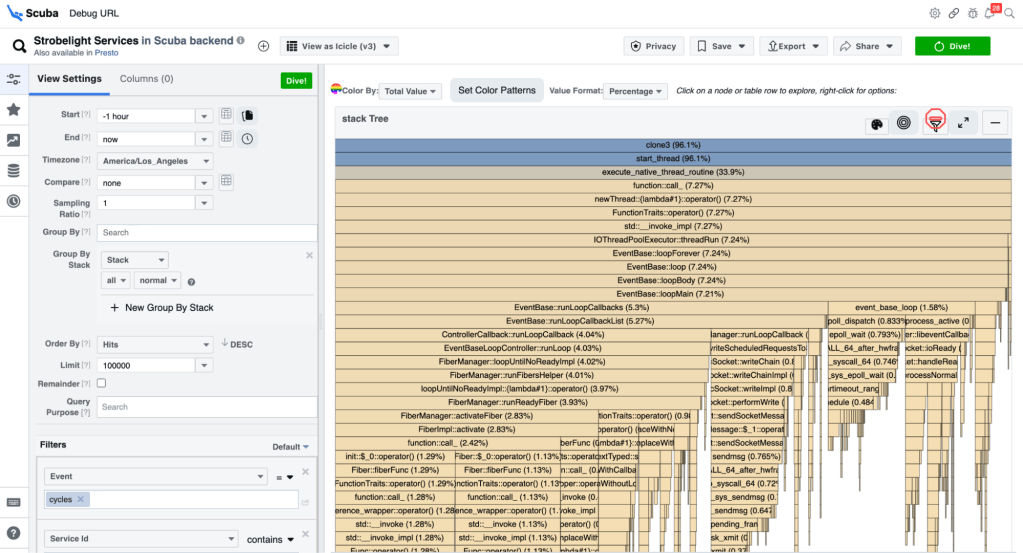
The primary tool Strobelight customers use is Scuba – a query language (like SQL), database, and UI. The Scuba UI has a large suite of visualizations for the queries people construct (e.g., flame graphs, pie charts, time series graphs, distributions, etc).
Strobelight, for the most part, produces Scuba data and, generally, it’s a happy marriage. If someone runs an on-demand profile, it’s just a few seconds before they can visualize this data in the Scuba UI (and send people links to it). Even tools like Perfetto expose the ability to query the underlying data because they know it’s impossible to try to come up with enough dropdowns and buttons that can express everything you want to do in a query language – though the Scuba UI comes close.
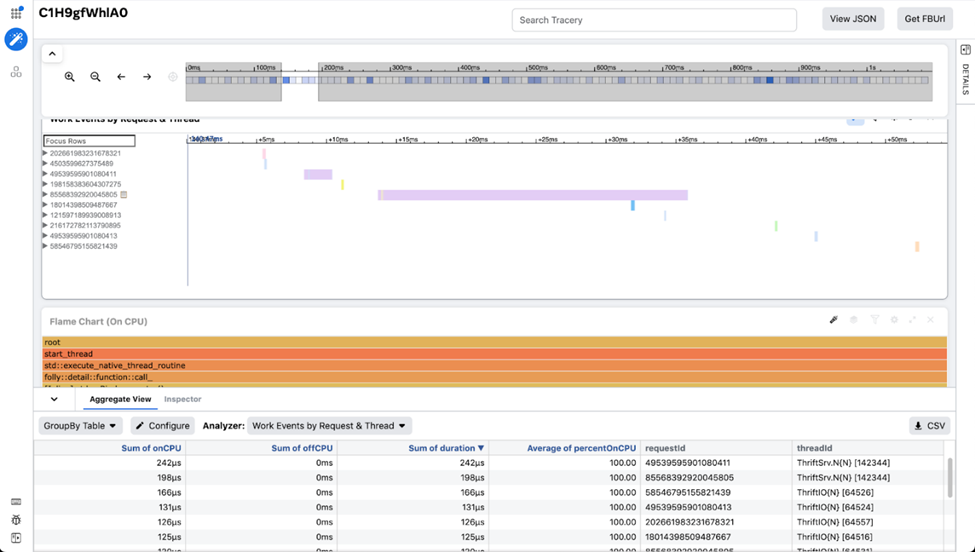
The other tool is a trace visualization tool used at Meta named Tracery. We use this tool when we want to combine correlated but different streams of profile data on one screen. This data is also a natural fit for viewing on a timeline. Tracery allows users to make custom visualizations and curated workspaces to share with other engineers to pinpoint the important parts of that data. It’s also powered by a client-side columnar database (written in JavaScript!), which makes it very fast when it comes to zooming and filtering. Strobelight’s Crochet profiler combines service request spans, CPU-cycles stacks, and off-CPU data to give users a detailed snapshot of their service.
The Biggest Ampersand
Strobelight has helped engineers at Meta realize countless efficiency and latency wins, ranging from increases in the number of requests served, to large reductions in heap allocations, to regressions caught in pre-prod analysis tools.
But one of the most significant wins is one we call, “The Biggest Ampersand.”
A seasoned performance engineer was looking through Strobelight data and discovered that by filtering on a particular std::vector function call (using the symbolized file and line number) he could identify computationally expensive array copies that happen unintentionally with the ‘auto’ keyword in C++.
The engineer turned a few knobs, adjusted his Scuba query, and happened to notice one of these copies in a particularly hot call path in one of Meta’s largest ads services. He then cracked open his code editor to investigate whether this particular vector copy was intentional… it wasn’t.
It was a simple mistake that any engineer working in C++ has made a hundred times.
So, the engineer typed an “&” in front of the auto keyword to indicate we want a reference instead of a copy. It was a one-character commit, which, after it was shipped to production, equated to an estimated 15,000 servers in capacity savings per year!
Go back and re-read that sentence. One ampersand!
An open ending
This only scratches the surface of everything Strobelight can do. The Strobelight team works closely with Meta’s performance engineers on new features that can better analyze code to help pinpoint where things are slow, computationally expensive, and why.
We’re currently working on open-sourcing Strobelight’s profilers and libraries, which will no doubt make them more robust and useful. Most of the technologies Strobelight uses are already public or open source, so please use and contribute to them!
Acknowledgements
Special thanks to Wenlei He, Andrii Nakryiko, Giuseppe Ottaviano, Mark Santaniello, Nathan Slingerland, Anita Zhang, and the Profilers Team at Meta.
The post Strobelight: A profiling service built on open source technology appeared first on Engineering at Meta.
What's Your Reaction?


![[FREE EBOOKS] Hacking and Securityy, The Kubernetes Book & Four More Best Selling Titles](https://www.javacodegeeks.com/wp-content/uploads/2012/12/jcg-logo.jpg)










![AI in elementary and middle schools [NAESP]](https://dangerouslyirrelevant.org/wp-content/uploads/2025/01/NAESP-Logo-Square-1.jpg)
